5 Tips for Debugging JavaScript Code
Effective Strategies for Identifying and Resolving JavaScript Bugs


Debugging JavaScript code in modern browsers can be challenging, especially when working on complex web applications. However, with the right tools and techniques, you can quickly identify and fix any issues in your code. By the end of it, you will explore some tips and tricks for debugging JavaScript code in modern browsers.
1) console.log()
Console is a powerful tool that allows you to debug JavaScript code directly in the browser.
Shift + CTRL + J
// Shortcut is used to open the console in the browser.
You can use the console to log messages, check the value of variables, and run JavaScript code snippets.
console.log(): Most common console command we use for debugging in JavaScript. Use this command to log messages to the console. You can also log the value of variables by passing them as arguments to the command.
let name = "Yash";
console.log("Hello, " + name); // Output: Hello, Yash
2) console.error()
console.error(): Use this command to log error messages to the console. It is used to identify that we are not on the wrong path.
let num = -1;
if (num< 0) {
  console.error("Number is less than 0");
}

3) console.warn()
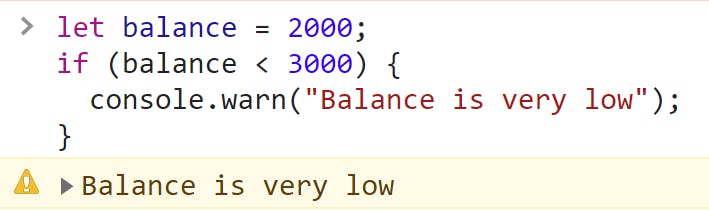
console.warn(): Use this command to log warning messages to the console.
let balance = 2000;
if (balance < 3000) {
  console.warn("Balance is very low");
}
4) console.table()
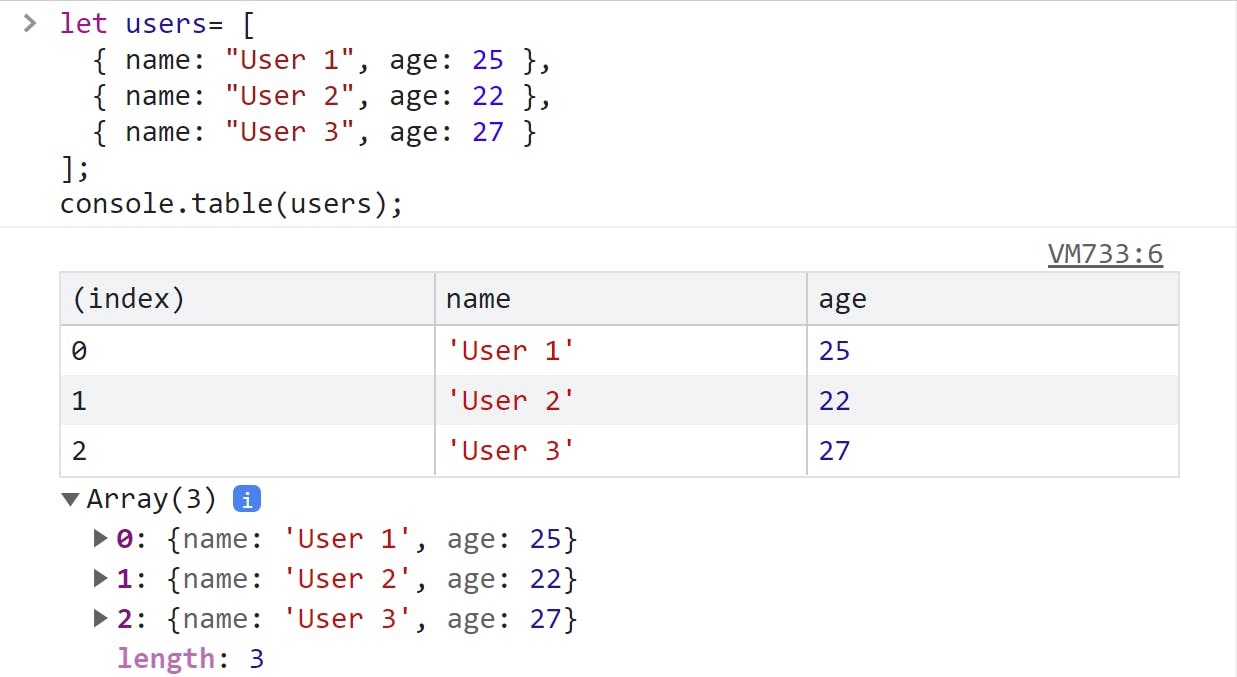
console.table(): Use this command to log data in a table format. You can pass an array of objects as an argument to the command. This arranged an array of object data in table form which is easier to read.
let users= [
  { name: "User 1", age: 25 },
  { name: "User 2", age: 22 },
  { name: "User 3", age: 27 }
];
console.table(users);
5) The Debugger Statement
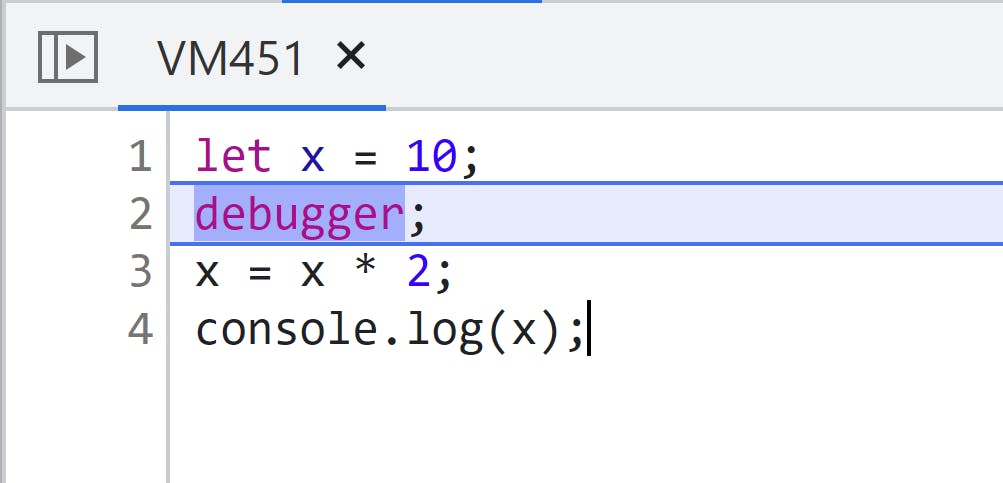
The debugger statement is a simple way to add breakpoints to your code without using the browser's debugging tools. When the debugger statement is executed, the code execution will pause, and you can use the browser's debugging tools to step through the code. Use the forward arrow to move to the next line.
let x = 10;
debugger;
x = x * 2;
console.log(x);

6) Conclusion
In conclusion, debugging JavaScript code in modern browsers is an essential skill for any web developer. It can be a complex and challenging task, but with the right tools and techniques, you can easily identify and fix any issues in your code. The console, breakpoints, the debugger statement are just a few of the powerful tools that can help you debug your code effectively. As you continue to develop your skills as a web developer, taking the time to learn how to debug your code properly can save you a lot of time and frustration in the long run.
Thanks for reading!
Happy Coding ^_^ !